- Home
- Industries
- Distribution, logistics and retail
The stock and cash in your network, measured point by point
For distributors, logistics operators, importers and store chains. We locate where data is lost between the warehouse and collection, measure it with your own records, and then implement.
Book a 30-min diagnosisTake the warehouse assessment (10 min)
Your network (select every part you run)
The plan below highlights the zones you select.
Fifteen points where goods drop out of sight
Each point has an indicator that measures it and a risk worth watching. Tap a point to see the formula, the applicable regulation and the Odoo 20 screen that records it.
A. Supplier and port
B. Distribution centre
C. Dock and route
D. Store and online store
E. Wholesale counter
Schematic plan. Point numbers follow the path of the goods.
Choose a point on the plan to see its sheet.
A. Supplier and port
A1 Container free days
A1 Container free days
- What usually happens
- The shipping line grants free days to return the container. The customs broker emails when only a few remain, and nobody in the company sees the date in a system.
- Indicator
- Import lead time = date received into stock − purchase order date.
- Risk to watch
- Containers with fewer than 3 free days ÷ containers in port or in transit. Threshold: zero.
- Regulation
- General Customs Law, Legislative Decree 1053, for clearance deadlines (SUNAT).
- In Odoo 20
- Purchase order with Incoterm and attached documents (bill of lading, commercial invoice, packing list). Free-day tracking is not standard: it is handled with scheduled activities or an integration.
A2 Landed cost
A2 Landed cost
- What usually happens
- Freight, insurance, duties and broker fees are added up in a separate spreadsheet weeks later; the selling price was already set on the FOB cost.
- Indicator
- Landed cost over FOB = (cost delivered to the warehouse − FOB) ÷ FOB, per shipment and per product.
- Risk to watch
- Products priced before their landed cost was closed.
- Regulation
- Allocation of costs and risks under ICC Incoterms 2020.
- In Odoo 20
- Landed costs split by quantity, weight, volume or value, updating the product cost in inventory.
B. Distribution centre
B1 Receiving
B1 Receiving
- What usually happens
- The operator counts boxes against the supplier’s delivery note and keys in the receipt at the end of the shift; differences surface when purchasing complains.
- Indicator
- Inventory accuracy by location = locations counted without difference ÷ locations counted.
- Risk to watch
- Receipts validated without a barcode scan.
- In Odoo 20
- One-, two- or three-step receipts with the Barcode app, lots, serial numbers and expiry dates.
B2 Counts and adjustments
B2 Counts and adjustments
- What usually happens
- Stock is counted once a year with the warehouse closed. Differences are adjusted to balance and nobody records the cause.
- Indicator
- Inventory accuracy by location, measured with cycle counts by product class.
- Risk to watch
- Negative adjustments without a reason ÷ inventory value, with a zero threshold. Gap between the valued perpetual inventory register and the inventory balance in the ledger.
- Regulation
- SUNAT Superintendence Resolution 234-2006: valued perpetual inventory register required above an income threshold.
- In Odoo 20
- Scheduled counts by location and inventory adjustments with a reason.
B3 Stock with no movement
B3 Stock with no movement
- What usually happens
- Management learns about idle product when the warehouse asks for space or when it expires.
- Indicator
- Days inventory outstanding (DIO) = average inventory at cost ÷ cost of sales × 365.
- Risk to watch
- Value of stock with no movement in 180 days ÷ inventory value. Product close to expiry, with the window set per category.
- Regulation
- IAS 2 Inventories: measured at the lower of cost and net realisable value.
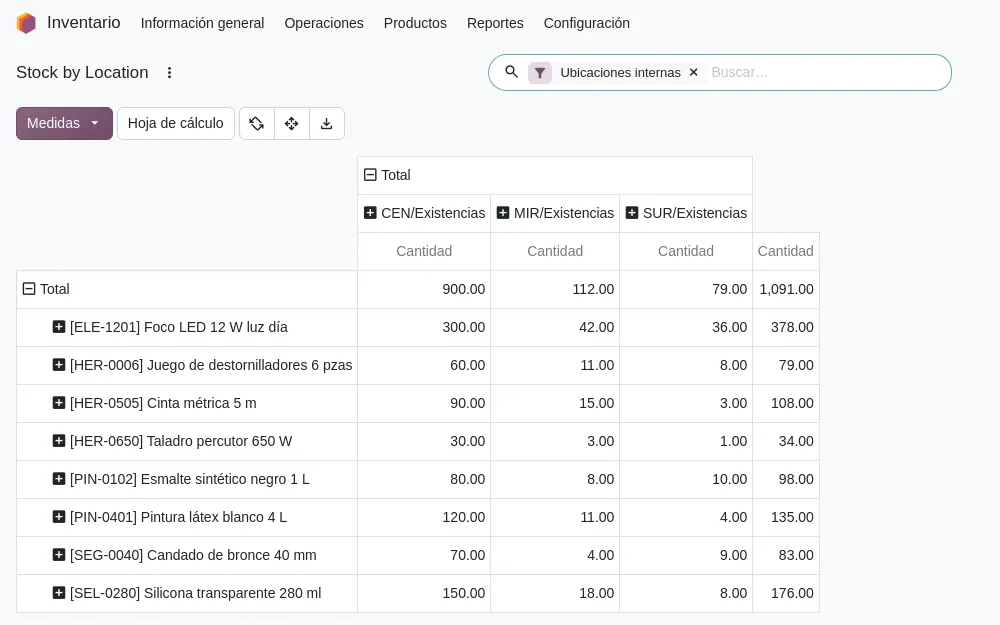
- In Odoo 20
- Stock by location and inventory valuation; FEFO removal for products with an expiry date.
B4 Order picking
B4 Order picking
- What usually happens
- The operator walks the warehouse with a printed list and ticks it with a pen. The error shows up when the customer calls.
- Indicator
- Picking accuracy = lines shipped without error ÷ lines shipped. Productivity = lines picked ÷ picking labour hours.
- Risk to watch
- Credit notes issued for dispatch errors.
- In Odoo 20
- Batch and wave transfers with every line scanned; a line is not validated if the code does not match.
C. Dock and route
C1 Electronic waybill
C1 Electronic waybill
- What usually happens
- The waybill is issued in the invoicing tool after the truck has left, or carries another order’s data.
- Indicator
- Perfect order = orders on time, complete, correctly documented and undamaged ÷ orders.
- Risk to watch
- Shipments without a valid waybill ÷ shipments. Threshold: zero.
- Regulation
- Peruvian Tax Code, Book IV, article 174: moving goods without the corresponding waybill is an offence punished with vehicle impoundment or a fine (SUNAT).
- In Odoo 20
- Electronic waybill issued from the delivery order, with the Peruvian localisation.
C2 Proof of delivery
C2 Proof of delivery
- What usually happens
- The driver confirms by phone or with a photo in a WhatsApp group. Failed deliveries return to the warehouse with no recorded reason.
- Indicator
- OTIF = orders delivered on time and in full ÷ orders delivered. Failed deliveries = deliveries returned ÷ deliveries scheduled.
- Risk to watch
- Deliveries returned without a reason.
- In Odoo 20
- Delivery validated with a signature and an attached photo. Routing with time windows and an offline driver app require an integration.
C3 Route settlement
C3 Route settlement
- What usually happens
- The driver comes back with cash, Yape or Plin receipts and returns. The settlement is put together on paper and the deposit arrives days later.
- Indicator
- Days of cash in transit = days between collection on the route and the bank deposit.
- Risk to watch
- Amount collected and not deposited within 24 hours ÷ amount collected. Threshold: zero.
- Regulation
- Internal control under the COSO framework.
- In Odoo 20
- Payments recorded on the invoice with one cash journal per driver. A single route settlement document is a minor development.
C4 Vehicle documents
C4 Vehicle documents
- What usually happens
- The expiry of the SOAT insurance, the roadworthiness test or the operating permit is remembered once the vehicle is already stopped.
- Indicator
- Vehicle capacity utilisation = weight or volume loaded ÷ capacity.
- Risk to watch
- Vehicles with documents expiring in under 30 days ÷ fleet. Threshold: zero.
- Regulation
- Road freight inspection by SUTRAN.
- In Odoo 20
- Fleet with contracts and expiry dates per vehicle.
D. Store and online store
D1 Empty shelf
D1 Empty shelf
- What usually happens
- The store manager orders by phone; the distribution centre ships what it has. The product runs out in one store and piles up in another.
- Indicator
- On-shelf availability = active products in stock at the store ÷ active products in the range.
- Risk to watch
- Fast-moving products out of stock for more than a day.
- Benchmark
- Corsten and Gruen (2003), a worldwide study with 2002 data and no breakdown for Peru: average out-of-stock rate close to 8%. Your company is compared with its own baseline.
- In Odoo 20
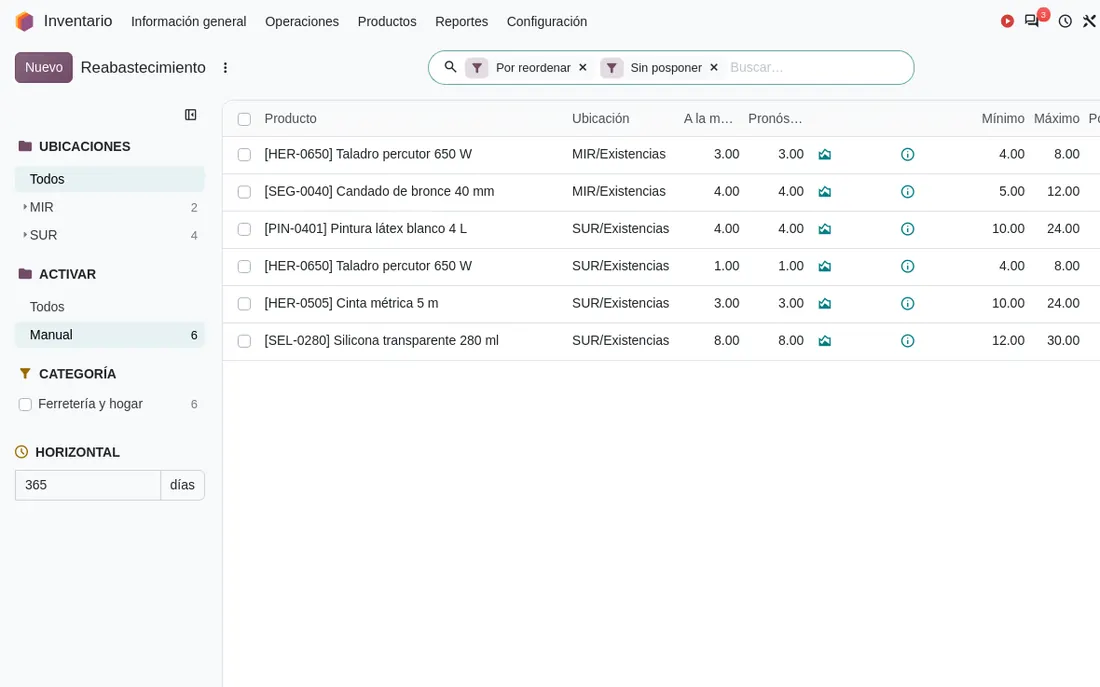
- Replenishment rules with minimum and maximum per product and per store.
D2 Till closing
D2 Till closing
- What usually happens
- The cash count is done on paper; voids and manual discounts are reviewed only when money is missing.
- Indicator
- Cash difference = (cash counted − cash expected) ÷ cash sales. Target: zero.
- Risk to watch
- Amount voided or discounted by hand ÷ sales.
- In Odoo 20
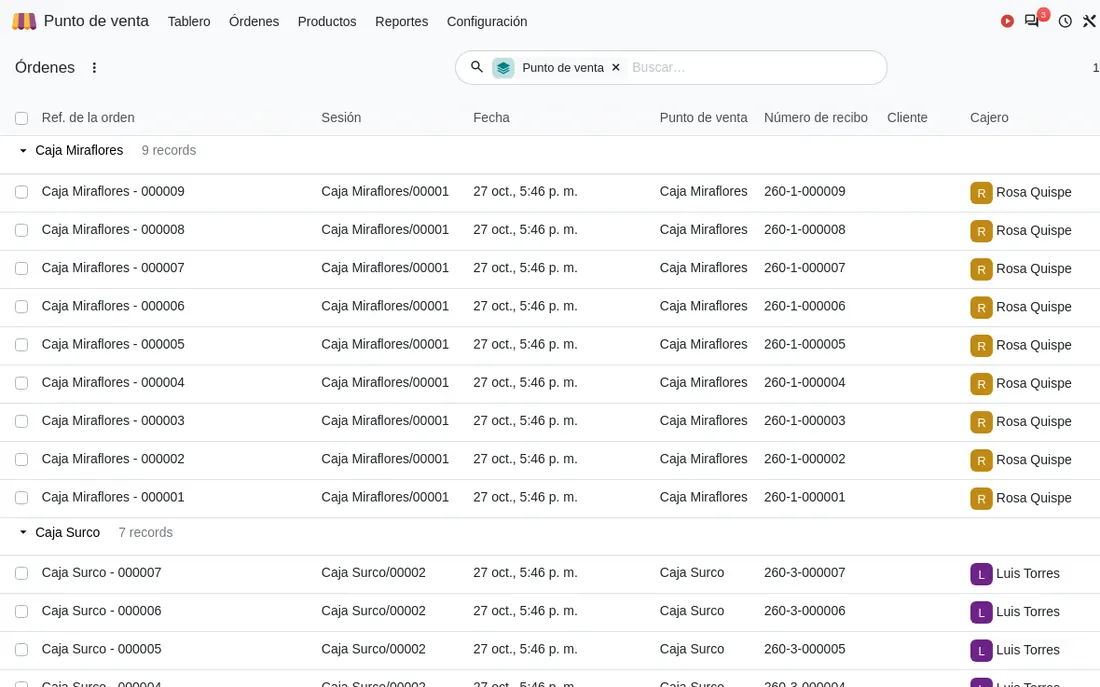
- Point of sale sessions with the cash difference recorded at closing and an electronic receipt or invoice.
D3 Shrinkage
D3 Shrinkage
- What usually happens
- What breaks, expires or disappears is written off at the year-end count with no cause and no store.
- Indicator
- Shrinkage over sales = shrinkage value ÷ net sales, per store and per cause.
- Risk to watch
- Shrinkage over sales above each category’s threshold.
- Benchmark
- National Retail Federation, National Retail Security Survey 2023: average shrink of 1.6% of sales in fiscal 2022 among US retailers. It is a foreign benchmark.
- In Odoo 20
- Scrap with a reason per location, and returns at the point of sale.
D4 Stock the online store sees
D4 Stock the online store sees
- What usually happens
- The online store or marketplace sells from stock loaded by hand once a day; the order arrives and the product is gone. The complaint goes into the complaints book.
- Indicator
- Online orders fulfilled in full ÷ online orders.
- Risk to watch
- Complaints answered after the legal deadline. Threshold: zero.
- Regulation
- Consumer Protection and Defence Code, Law 29571, and the complaints book (INDECOPI).
- In Odoo 20
- eCommerce on the same inventory, with click and collect. Marketplaces connect through an external connector.
E. Wholesale counter
E1 Credit and overdue receivables
E1 Credit and overdue receivables
- What usually happens
- The sales rep ships to a corner shop with overdue debt because nobody sees it when taking the order. The rep decides the discount and the margin is known at month-end.
- Indicator
- Days sales outstanding (DSO) = average receivables ÷ credit sales × 365. Gross margin per customer.
- Risk to watch
- Receivables more than 60 days overdue ÷ total receivables. Customers over their limit and lines sold at a negative margin, with a zero threshold.
- Regulation
- IFRS 9, expected credit loss.
- In Odoo 20
- Credit limit per customer with a warning when the order is confirmed, customer price lists and multi-level payment follow-up.
One 18-line order, recorded two ways
The same order from a corner shop, shipped with your own fleet and paid on delivery. Switch the view to see what evidence remains at each step and which indicator it lets you calculate.
Indicators you can calculate from the evidence: 0 of 66 of 6
| Step | Today, with paper and messages | With the process in Odoo 20 | Indicator you can calculate |
|---|---|---|---|
| Order | Today, with paper and messagesWhatsApp message to the sales rep with the product list. The price is confirmed from memory. | With the process in Odoo 20Sales order with the customer’s price list and the approved discount. | Indicator you can calculateQuotation lead time; margin per line |
| Stock reservation | Today, with paper and messagesA call to the warehouse to ask whether there is stock. | With the process in Odoo 20Reservation by location when the order is confirmed.See the screen | Indicator you can calculateAvailability at confirmation |
| Picking | Today, with paper and messagesPrinted list ticked with a pen. | With the process in Odoo 20Every line scanned; a line is not validated if the code does not match. | Indicator you can calculatePicking accuracy |
| Waybill | Today, with paper and messagesWaybill issued in the invoicing tool after the truck left. | With the process in Odoo 20Electronic waybill issued from the delivery order. | Indicator you can calculateShipments without a valid waybill |
| Delivery | Today, with paper and messagesThe driver phones the dispatch office. | With the process in Odoo 20Delivery validated with a signature and a photo. | Indicator you can calculateOTIF; failed deliveries with a reason |
| Collection | Today, with paper and messagesPaper settlement sheet on returning to the depot. | With the process in Odoo 20Payment recorded on the invoice, in the driver’s journal. | Indicator you can calculateDays of cash in transit; days sales outstanding |
Fictitious order. Screens come from a lab Odoo instance with demo data.
Days of cash held up in your network
Inventory and receivables are money the company has already paid or earned and does not yet hold. With six figures from your financial statements, the calculation gives the cash conversion cycle and the value of each day.
Result
Cash conversion cycle days
- Days inventory
- Days receivable
- Days payable
- No-movement stock over inventory
- Value of one day of inventory
- Value of one day of receivables
- Cash in transit from the route
- Fill in both route fields
- Annual financing cost of inventory and receivables
- Enter the annual rate
- Annual financing cost of one day of inventory
- Enter the annual rate
The calculation shows cash held up and its cost. How many days can be cut is set against your own best month in the F1 diagnosis, with your records.
One day less of inventory frees its value only once; the annual saving is only its financing cost, if that balance was funded with debt.
Formulas used
- Days inventory = average inventory ÷ cost of sales × 365
- Days receivable = receivables ÷ credit sales × 365
- Days payable = payables ÷ cost of sales × 365
- Cash conversion cycle = days inventory + days receivable − days payable
- No-movement stock over inventory = no-movement stock ÷ average inventory
- Value of one day of inventory = cost of sales ÷ 365; of one day of receivables = credit sales ÷ 365
- Cash in transit = route collection per day × days to deposit
- Annual financing cost = (average inventory + receivables) × annual rate
Cash conversion cycle: SCOR Digital Standard, asset metric (ASCM).
Send me this calculation on WhatsApp
Days-of-cash calculation (odoo.dmunozgroup.com/soluciones/distribucion-retail): inventory {dio} days, receivables {dso} days, payables {dpo} days, cycle {ccc} days, one day of inventory S/ {dia}.
The data you already have to measure the change
Before implementing, we measure. The assessment walks through your purchasing, warehouse, delivery, store and collections, and at the end you can load your 12-month baseline. With it, the report calculates your indicators and sets out ROI, NPV, IRR and payback with the assumptions in plain view.
What the report delivers
- The level of six dimensions: coverage and no-movement stock, counts and adjustments, dispatch and waybill, route cost and cash in the field, shrinkage and shelf, credit and days receivable.
- The three lowest gaps with their indicator, their risk and the financial lever they move.
- The indicators calculated from your baseline, if you loaded it.
- The benefit formulas with your data and the assumptions labelled as editable.
With 0 of 12 data items, the report calculates: . The rest is measured in F1 with 2 to 4 weeks of sampling.Tick at least one item.
- Days inventory
- Gross margin
- Shrinkage over sales
- No-movement stock over inventory
- Unexplained adjustments over inventory
- Cost per order
- Errors per 1,000 orders
- Annual cost of errors
- Cost per delivery and failed deliveries
- Days of cash in transit
- Cash difference
- Days receivable and overdue receivables
- Annual valuation, NPV and discounted payback
The ticks are not sent anywhere. Data you load in the assessment is used only for your report.
Warehouse analysis: location, picking and dispatch
Questions on stock by location, replenishment, order picking, dispatch to routes and stores, inventory accuracy and traceability. The result locates the gap: at receipt, at picking or at dispatch.
For the meeting, have at hand:
- The list of stores and warehouses
- How a store is replenished today
- A sales-by-product report for last month

Three cases, ranked by payback
The order follows the expected discounted payback and how easily the benefit can be measured with data from the system itself. The value of each case is calculated from your baseline, not from industry averages.
Accurate inventory and coverage-based replenishment
- Indicator that proves it
- Accuracy by location, on-shelf availability, days inventory
- Risk it reduces
- No-movement stock, unexplained adjustments, gap with the valued inventory register
- Standard Odoo 20
- Inventory, Barcode, scheduled counts, replenishment rules
- What is not standard
- Seasonal forecasting, in a second stage
- Why it ranks here
- Standard apps, no integrations; frees cash once, and the before and after come from the same system
Error-free dispatch with electronic waybill and route settlement
- Indicator that proves it
- Picking accuracy, OTIF, perfect order, days of cash in transit
- Risk it reduces
- Shipments without a valid waybill, unsettled cash, expired vehicle documents
- Standard Odoo 20
- Batch and wave transfers, Barcode, electronic waybill, Fleet
- What is not standard
- Routing with time windows, offline driver app, single settlement document
- Why it ranks here
- Cuts rework, credit notes and exposure to fines with low-cost scanners; routing stays an optional phase
Wholesale credit and collections with controlled margin
- Indicator that proves it
- Days receivable, cash conversion cycle, margin per customer
- Risk it reduces
- Receivables over 60 days, customers over their limit, sales at a negative margin
- Standard Odoo 20
- Credit limit, price lists, payment follow-up, bank reconciliation
- What is not standard
- Bills of exchange and factoring, credit scoring
- Why it ranks here
- Frees cash through process and configuration; the effect shows in the next collection cycle and depends on sales discipline
Landed cost, store shrinkage, and full TMS and YMS are assessed later: they depend on the number of shipments, on reliable store inventory, or on integrations that lengthen the payback.
Before and after, measured on your calendar
An improvement measured in December against an October proves nothing. We set the base period, the measurement cut-offs and the year-on-year comparisons before touching the system.
- Jan
- Feb
- Mar
- Apr
- May
- Jun
- Jul
- Aug
- Sep
- Oct
- Nov
- Dec
- Year-end and stocktake JanClosing and stocktake month in many companies.
- Back to school Feb–MarCompared with the previous year’s campaign.
- Mother’s Day MayCompared with the same month last year, for stores and consumer goods.
- National holidays and July bonus JulCompared with the same month last year.
- Christmas and December bonus Nov–DecCompared year on year; never used as the base period.
- Day 0
- Day 30
- Day 90
- Day 180
A cut-off falls inside a marked season: that cut-off is compared with the same month last year.No cut-off falls in a marked season.
Cyber sale events change date every edition: they are excluded or compared with the previous edition.
Day 0 Apr
Each committed indicator, with the same query that will be used later.
Signed by: finance or management control.
Day 30 May
Process adoption: moves validated with a scanner, orders in the system, products with barcode, weight and volume.
Signed by: process owner.
Day 90 Jul
Inventory and picking accuracy, OTIF, availability, days of cash in transit, admin hours; first realised benefit.
Signed by: indicator owner and finance.
Day 180 Oct
Days inventory and receivable, cash cycle, shrinkage, margin, write-offs, fines; ROI, NPV, IRR and payback with actual cash flows.
Signed by: executive committee.
Normalisations
- By volume: orders, lines, deliveries, tickets.
- At constant base-period prices.
- By channel mix.
- By number of open stores.
Exclusions agreed in writing
- Store openings or closures.
- Change of logistics operator.
- Transport strikes.
- SUNAT or Ministry of Transport rule changes.
- Exchange-rate swings on imports.
Which system covers each zone of the plan
We implement Odoo where its standard covers the process. Where it does not, we say so and help you choose or integrate the tool.
| Zone | System | Scope |
|---|---|---|
| A. Supplier and port | Foreign trade | We implement |
| e-Procurement and approvals | We implement | |
| Supplier management (SRM) | We assess and help you choose | |
| B. Distribution centre | Warehouse management (WMS) | We implement |
| Yard and dock appointments (YMS) | We assess and help you choose | |
| C. Dock and route | Transport management (TMS) | We assess and help you choose |
| Fleet management | We implement | |
| D. Store and online store | Point of sale | We implement |
| Multi-store retail | We implement | |
| eCommerce | We integrate | |
| E. Wholesale counter | Electronic data interchange with chains (EDI) | We assess and help you choose |
Limits of the standard
- Routing with time windows and capacity: an external optimiser connected to deliveries.
- Offline driver app with stop sequence: integration.
- Dock appointments and yard control: Odoo has no app for this; a specialised tool is connected.
- Shipment tracking with free days: scheduled activities or integration.
- Customs declaration: Odoo does not file with SUNAT Customs; the broker’s data is imported.
- Logistics operator rate card per pallet position per day: development.
- Marketplaces: external connector.
Common questions on warehouse, delivery and stores
Opening inventory and migration
It is loaded from a physical count by location, not from the previous system’s balance. We start with one warehouse and its fastest-moving products, and the rest comes in through scheduled counts.
Scanners and devices
The Barcode app works with handheld scanners, Android terminals and a phone camera. Devices are chosen after measuring lines per hour in the pilot.
Electronic waybill
It is issued from the delivery order with the Peruvian localisation. We check with your current invoicing provider whether the carrier waybill for your own fleet is covered or needs an extra step.
Third-party carriers
They keep working the same way. What changes is that the delivery is validated in the system and their freight invoice is matched against the trips.
Logistics operator holding customers’ stock
Odoo handles stock ownership per customer. The rate card per pallet position per day and per movement is developed separately.
Starting with one site or everything
With one warehouse and one store, or one warehouse and one route. We measure that pilot against the baseline and then move on to the rest.
Data the assessment asks for
None are mandatory. The baseline is optional and can be loaded later in the chat with the template.
Peak season in the middle of the project
It is planned so the pilot does not start during a campaign and measurement compares against the same period last year.
Review one point of your network with Diego
Bring one month’s report from your most critical zone. In 30 minutes we place your control points on the plan, review which indicators you can already calculate, and walk through the flow in the lab Odoo.
What to bring, by network
- The latest count with its adjustments
- One customer’s storage billing
- One day’s route sheet and its settlement
- The file of a closed shipment with its landed cost
- One store’s till closing and latest count
- The receivables ageing report
- One week of online orders with their status
Book a 30-min diagnosisTake the warehouse assessment (10 min)
Message Diego on WhatsApp Diego Muñoz replies in person, on Lima time.