Metrics that match across departments and arrive in time to decide
I sort out what is measured and where each figure comes from, automate loading from the ERP and your other systems, and build the dashboards your management uses every week.
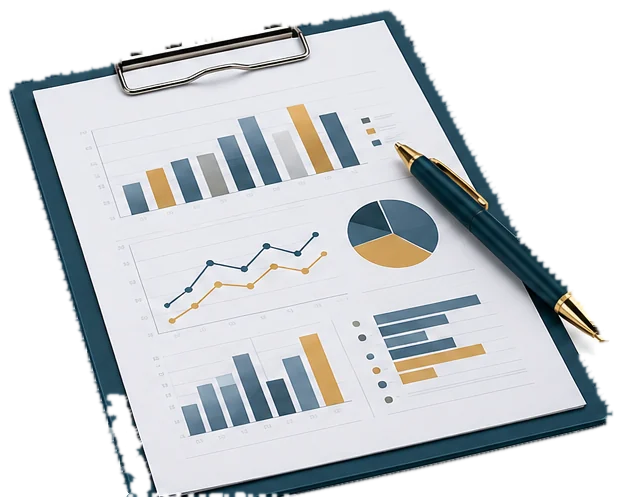
35questions on metrics, loads and dashboard use, in 8 minutes
A shared data model, documented metrics and dashboards that update themselves
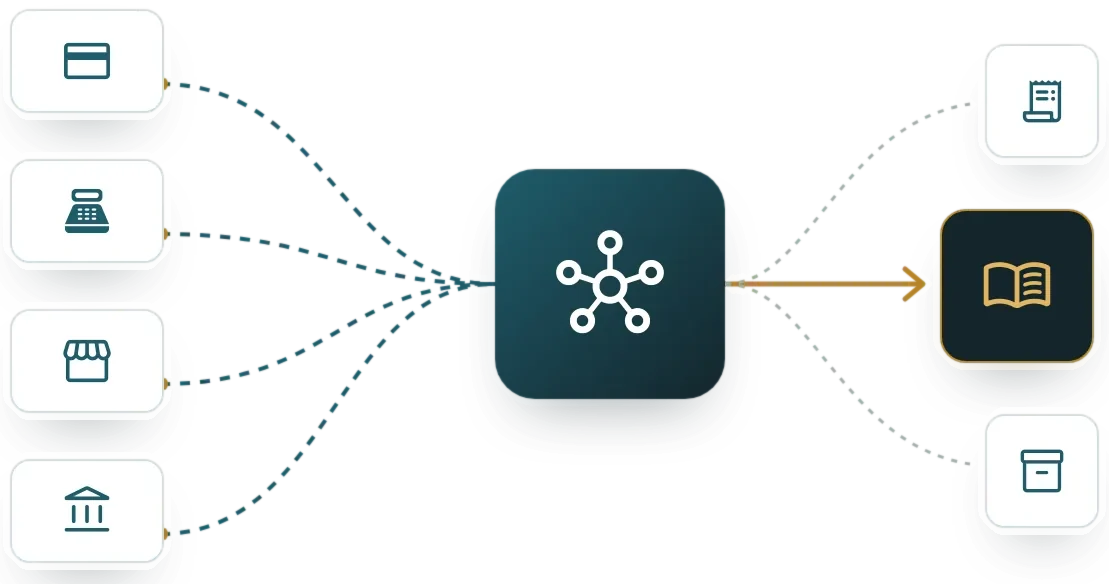
Business intelligence (BI) brings data from several systems into a shared model and presents it in dashboards with defined metrics. The data warehouse keeps history and lets you join sales, costs and operations without loading the ERP.
The dashboard tool is the visible part. What decides whether management trusts the numbers is each metric’s definition, automated loading and quality checks.
Signs your company needs one
- Management reports are built by exporting to Excel
- Two departments present different figures for the same metric
- There are dashboards, but nobody trusts their numbers
- There is no written definition of each metric
- Joining data from two systems takes someone from IT
- Reports arrive days after closing
BI: who it is for and when it does not fit
A good fit for
- General, sales and finance managers who review results every week
- Companies with an ERP and at least one other source: online store, field spreadsheets or a legacy system
- Management control teams that build the monthly report by hand today
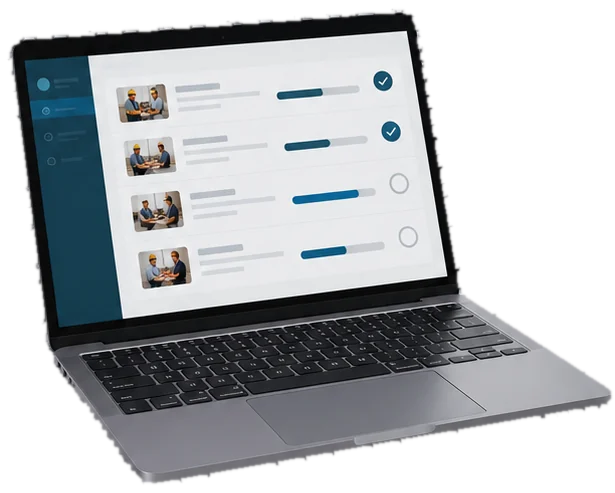
Not a fit when
- Everything lives in Odoo and its standard reports or spreadsheets already answer the questions asked
- The source data is not yet recorded in any system
- Nobody in the company will look at the dashboards once published
The cost of staying as you are
Meetings spent reconciling
When each department brings its own figure, the meeting goes on explaining differences and the decision is postponed.
Hours of assembly
Exporting, pasting and checking every month eats hours of people who could be analysing instead of preparing.
Decisions on old data
A report that arrives a week after closing shows what already happened, not what can still be corrected.
How I assess BI in four steps
The dashboard is designed last. First come the decisions it must serve and each metric’s definition.
I start from the decisions
What management decides each week and which metric it needs to do so.
I write each metric’s definition
Formula, source, owner and frequency, agreed with the departments before building.
I automate the loading
From the ERP and other systems into the shared model, with quality checks and an alert on failure.
I publish and measure use
Dashboards by role, trained key users and a review of what gets used and what gets retired.
What your company provides for the business intelligence project
Current decisions and reports
The spreadsheets management circulates today and who decides what with each one.
Read access to the sources
A read-only user on the ERP, database or API of each source system.
One owner per metric
The person in the department who approves the formula and answers when the figure does not match.
Tool licences
Those of the chosen BI tool, in your company’s name, for authors and for viewers.
From assessment to implementation
Metric definitions
A metric catalogue with formula, source and owner, agreed with each department.
Data model and loads
A warehouse or shared model with scheduled loads from the ERP and other systems.
Dashboards by role
Management and operational dashboards, with access by department and key-user training.

Diego Muñoz
I implement business intelligence: metric cards, automated loads from the ERP and other systems, a data model and dashboards in the best-fit tool (Power BI, Odoo, Metabase or another), with trained key users.
I implement this type of system
Take the assessmentMarket options
Dashboard tools look alike on the surface. The differences lie in the licensing model, the connectors and row-level security.
Odoo Dashboards and Spreadsheet
Odoo includes dashboards and spreadsheets connected to its own data. They are enough when almost everything lives in Odoo; with several sources or a lot of history, a separate data model and a BI tool make more sense.
Other platforms I assess
- Microsoft Power BI
- Tableau
- Looker
- Qlik Sense
- Apache Superset / Metabase
- Snowflake
- Google BigQuery

Selection criteria
- Number of data sources and how much history you need
- Viewers and authors, which drive the cost
- Row-level security so each person sees only their own data
- Connectors to your ERP and other systems
- Your team’s ability to maintain the model
BI: limits and alternatives
Data that does not exist
A dashboard does not fix a record nobody makes. If the source data is missing, the process that captures it is adjusted first.
Real time
Scheduled loads cover most management decisions. If an operation needs data by the minute, it is read straight from the source system.
Data science
Forecasts and statistical models are a separate project that starts from an already organised data model.
Which other systems it connects to
Enterprise resource planning
Main source of sales, purchasing, inventory and costs.
See the systemAccounting and financial ERP
Accounting figures and budget, with the same cut-off date as the reports.
See the systemMaster data management
Customers and products without duplicates, so totals do not split.
See the systemIntegration platforms (iPaaS/ESB) and APIs
Scheduled loads and connection to external sources.
See the systemEnterprise performance management
Budget and forecasts against actuals, in the same model.
See the systemArtificial intelligence and agents
Natural-language questions on metrics already defined.
See the system35 questions and 8 minutes to see where to start
This assessment reviews how the indicators reaching your management are defined, loaded and used. The questions describe observable situations in KPI sheets, data model, loads, dashboards and access.
Scored dimensions
- KPI definition sheets. It looks at whether each indicator management reviews has a written and approved formula, source, cut-off, owner and the decision it supports.
- Data model and quality. It looks at whether a shared model with measures, grain and history exists, whether controls detect missing data and whether a figure can be traced back to its source.
- Data loads and timeliness. It looks at whether ERP, fleet dispatch, scale and payroll data reach the model automatically, at a frequency agreed per decision and with an alert when a load fails.
- Dashboard use and self-service. It looks at whether dashboards are opened in decision meetings, whether usage is measured and whether key users build their own queries without relying on one person.
- Access and change control. It looks at whether each user sees only the data they are entitled to and whether formula changes are approved, versioned and announced with a date.
What you receive
At the end you receive your business intelligence level across five dimensions and the gaps ranked by weight. Each gap includes a first verifiable action for your team.
17 scored questions and 13 context questions (type of operation, size, current system). Context questions are not scored: they let us read the result against similar operations.
Free of charge. Only Diego Muñoz sees your answers.
Before you start
If almost everything is in the ERP and you do not need much history, dashboards on the ERP are usually enough. With several sources, heavy joins or years of history, a warehouse avoids loading the ERP and organises the model.
With whichever best fits your users, budget and existing tools: Power BI, Odoo dashboards, Metabase or another. The work on definitions, model and loads applies to any of them.
With the definitions of the most disputed metrics and the source of each figure. Distrust almost always comes from different formulas or cut-offs, not from the tool.
The online assessment and the 30-minute review with Diego are free and carry no commitment.
Only Diego Muñoz sees them, to prepare the review. They are not shared with third parties or used for bulk mailings.
Review your BI case with Diego in 30 minutes
Diego Muñoz replies in person, on Lima time. If you have taken the assessment, he comes with your answers already read.
WhatsApp +51 919 488 260 · damunoz@dmunozgroup.com