Profitability by project and by business line, visible while there is still time to correct it
Diego defines with management the indicators it reviews every week and connects them to what your team already records: purchase orders, invoices, stock issues and hours.
Dashboards inside Odoo 17 to 20 or in your BI tool, with every indicator defined in writing
Management learns a project’s margin once it is already over
While the project runs, the real cost is spread across invoices, daily reports and each area’s spreadsheets. Someone pulls it together at month end, and by then the overrun has already happened.

Daily reports in the field
Equipment and crew hours are written on paper or in a WhatsApp group, and reach the office days later.

Stock issues with no project
Material leaves the warehouse, but nobody records which project or budget line it belongs to, so it is reclassified at month end.

Third-party services invoiced late
Fuel, transport and subcontracts become known when the invoice arrives, sometimes a month after they were consumed.
What it costs to keep going like this
Decisions after the month is closed
The budget line that overran shows up in the report when there is no room left to correct it.
Figures that do not match between areas
Operations and accounting arrive at the meeting with two different margins for the same project.
Hours spent building the report every week
Exporting, matching and fixing spreadsheets takes up people who should be analysing the figure.
What building the management report costs today
Use your own figures. The result stays on your screen, is not sent anywhere and shows the cost of the manual task; it is not a savings promise.
First the indicator is defined with management; then the dashboard is drawn
DMG-RT is Diego’s own method. Every dashboard answers a business indicator with a written formula, source and owner, and it is measured with the same query before and after implementation.
Diagnosis: management’s questions and where each number comes from
Diego writes down the questions management asks every Monday and traces each figure back to its source: which module, which spreadsheet, who records it and how many days late. He measures how long the report takes today and how many records arrive without a project or budget line.
Deliverable: inventory of questions and sources, data quality map and baseline, in 15 working days.
Design: one sheet per indicator and an analytic plan
Each indicator gets its sheet: formula, exact source, frequency, owner and target. The analytic plan of projects and budget lines is defined, along with the rule that assigns every invoice, stock issue and hour when it is recorded. Management approves the sheets before anything is built.
Deliverable: approved KPI sheets, analytic plan and dashboard mock-up.
Implementation and control: the dashboard with real data every two weeks
Recording at the source and the dashboard are configured in Odoo, or in your BI tool if the data comes from several systems. Each two-week cycle ends with the dashboard reviewed in the weekly meeting and the corrections written in the minutes.
Deliverable: dashboard in operation, deviation alerts and weekly minutes.
Handover: every indicator with an owner in your company
Each indicator is assigned to a person on your team, with a manual to read it and fix records. The 3, 6 and 12-month reviews use the same query as the baseline.
Deliverable: closing record, operating manual and scheduled reviews.
KPI sheet
Example of the sheet management approves in F2
- IndicatorMargin by project
- FormulaAmount billable to the client minus real cost
- SourceProject analytic items in Odoo
- BaselineLast 12 weeks, signed by finance
- FrequencyWhenever an operation is recorded
- AlertBudget line above the threshold you set
- OwnerProject manager, with a deputy
The phase you are reading is highlighted on the sheet.
The dashboard is built from what your team already records in Odoo
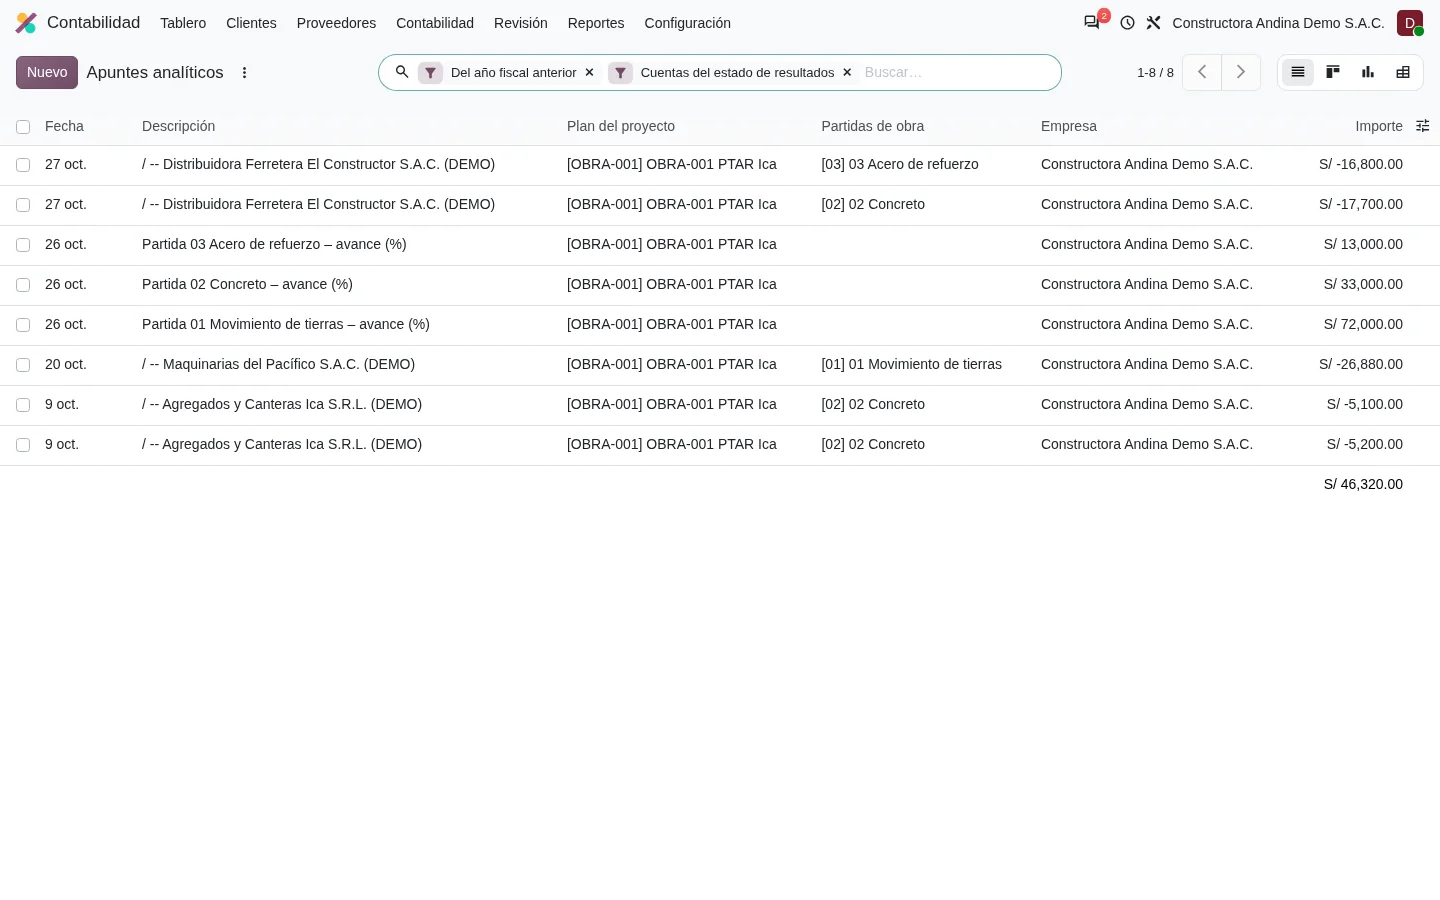
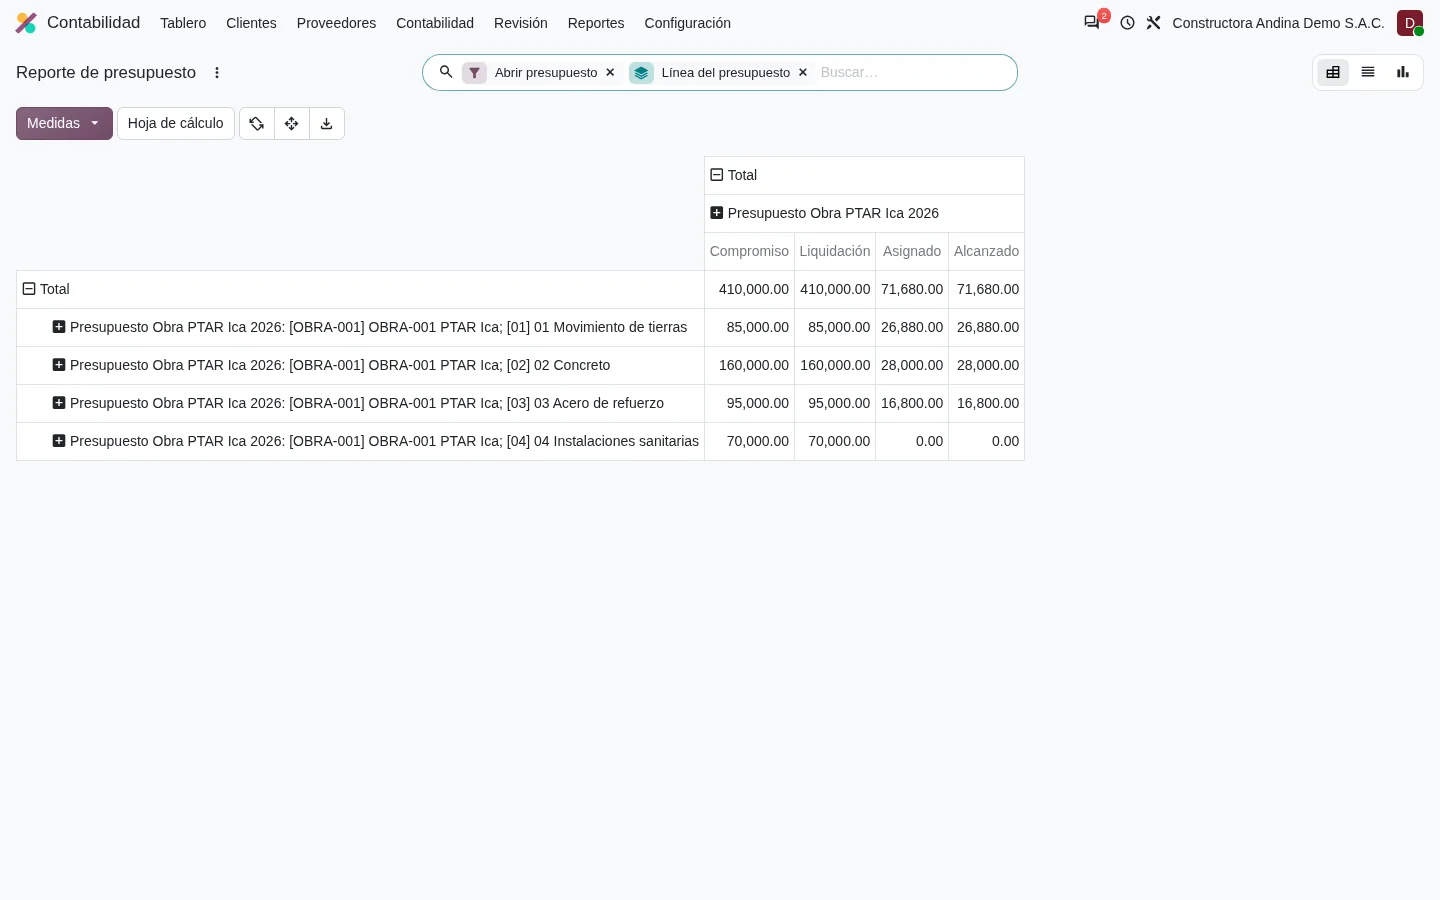
Three screens from a demo construction project: cost charged to the project when it is recorded, budget compared with actuals, and the view management opens on Monday.
Swipe the screen left to see every column.
Every expense comes in with its project and budget line
- The supplier invoice already carries the project plan and the budget line.
- Progress billable to the client appears in the same list, with a positive sign.
- The total at the bottom is the margin for the filtered period.
Swipe the screen left to see every column.
How much was committed and spent on each budget line
- The standard budget report matches the budget against purchase orders and invoices.
- A budget line with no consumption stands out as much as one that overran.
- It is exported to a spreadsheet only if someone asks for it.
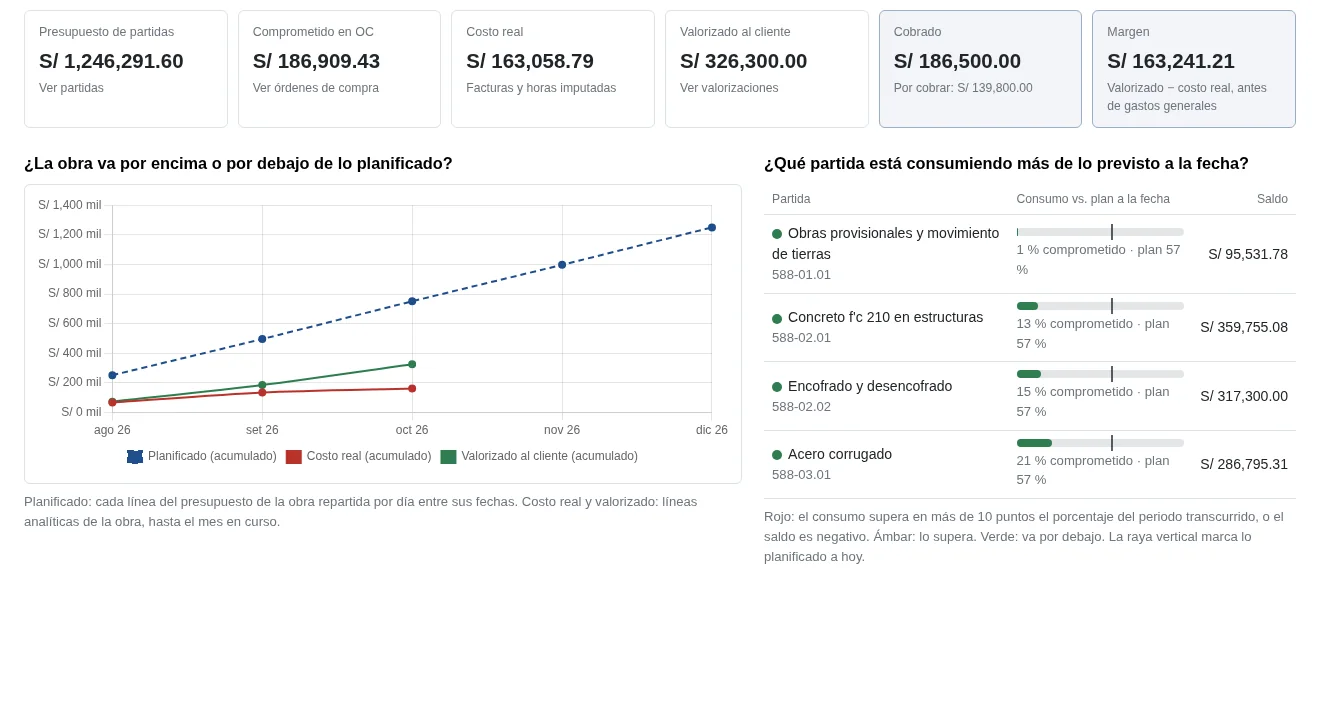
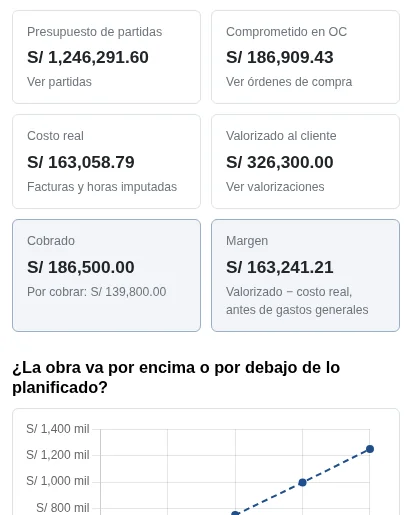
The project against plan, on one screen
- Six figures at the top: budget, committed, real cost, billable, collected and margin.
- The curve compares planned against accumulated cost and billable amounts.
- Each budget line shows consumption against plan to date and turns red when it runs ahead.
Screenshots from an Odoo 20 demo instance with fictitious data. The screens are in Spanish.
Is your data good enough for a dashboard? The process self-assessment shows what is not being recorded yet.
Take the process self-assessment (7 min)If your data is incomplete, the first deliverable is putting it in order
A dashboard on messy data only shows the mess faster. That is why recording is fixed at the source, on the screen where your team works, before the first chart is drawn.
| What you see | Why it happens | What changes |
|---|---|---|
| Expenses with no project | Why it happensThe project is optional when the invoice is recorded | What changesMandatory analytic distribution on purchases and stock issues |
| One client under three names | Why it happensAnyone can create contacts and products | What changesMaster data clean-up and one person in charge of creating records |
| Hours on loose sheets | Why it happensThe daily report is not in the system | What changesTimesheets by project in Odoo, from a phone |
| Two margins for the same project | Why it happensEach area uses its own formula | What changesOne KPI sheet approved by management and finance |
If the diagnosis shows the data is not enough, the baseline is measured by hand for 2 to 4 weeks with a written protocol, and the dashboard comes in once recording is reliable.

What you bring and what you receive
You bring
- The questions management needs answered every week.
- Read access to your ERP and to the spreadsheets that feed the report today.
- Someone from finance to sign the baseline.
- The users who record purchases, stock and hours, to adjust their screens.
You receive
- KPI sheets with formula, source, owner and target.
- An analytic plan by project, budget line or business line.
- A dashboard in Odoo or in your BI tool, readable on desktop and phone.
- Deviation alerts by budget line and an operating manual in your company’s name.
Dashboard inside Odoo
When purchasing, stock, hours and accounting are already in Odoo. It updates on every entry and needs no other licence.
BI tool
When data comes from several systems or from previous years. A common data model is built and refreshes are scheduled at the agreed frequency.
When a dashboard is not the right first step
If purchasing and stock are still recorded outside a system, the dashboard has nothing to read from. In that case the first workstream is recording in an ERP.
Systems involved in a profitability dashboard
- BI and data warehouseIndicators from several sources with a single definition.
- Master dataOne client, one product and one supplier, each with a single code.
- Budgeting and performance managementA budget compared with actuals every month.
- Professional servicesHours and costs that reach the project invoice.

Diego works on the definition with management and on recording with your team
Diego Muñoz is a process and systems consultant based in Lima. On a data project he spends half his time with the people who record: the storekeeper, the site manager, the accounting assistant. The dashboard comes out right when those screens are right.
- One business indicator for each dashboardNo chart enters the plan without a decision that uses it.
- The same query before and afterThe baseline and the result are calculated the same way, and finance signs it.
- Control lives in your systemIndicators, actions and minutes stay in your ERP, not in the consultant’s files.
- Odoo 17, 18, 19 and 20
- Analytic accounting and budgets
- Enterprise architecture with TOGAF
Questions before asking for a dashboard
Do I need Power BI or another tool?
Not always. If the data is in Odoo, the dashboard lives inside Odoo. If it comes from several systems, a BI tool is assessed and you get in writing which licence it needs.
How often does it refresh?
Inside Odoo, at the moment the operation is recorded. With external sources, at the frequency set on each indicator’s sheet.
What if my data is incomplete?
It shows up in the diagnosis. Sometimes the first step is to fix how cost is recorded, and the dashboard comes afterwards.
Can management see it on a phone?
Yes. Views are tested on desktop and phone before each delivery.
Who sees which figures?
Permissions are set by role: a site manager sees their project and management sees all of them. They are configured with Odoo access groups.
How is the project paid?
With a fixed amount per phase. At the end of each phase you decide whether to continue.
Review with Diego which indicator your management needs, in 30 minutes
- You bring the report you build by hand today.
- Diego reviews where each number comes from and what is not being recorded.
- You receive in writing the first indicator to build, or the preliminary task if the data is not enough yet.
Diego Muñoz replies in person, on Lima time.